OK, so we have gone over the basic setup and dug a bit more into the reactivity functionality. Now we are going to look at UI extensions aka html5 and css.
Working with the HTML
The functions in the UI create HTML. So why don’t we add some static content? Shiny comes with a series of tags functions that will create HTML for you. Here is an example:
library(shiny)

ui <- fluidPage(

  # a tag is an anchor
  tags$h1("Title 1"),
  tags$a(href = "www.rstudio.com", "RStudio"),
  tags$p("This is my app para 1."),
  tags$p("This is my app para ", tags$strong("2!!")),
  tags$br(), # Page break
  tags$p(style = "font-family:Impact", "This is my app para 3 with a custom style!!!"),
  tags$hr(), # Horizontal rule
  tags$code("This is my app"),
  tags$br(), # Page break
  # To use your own media create a www folder and chuck your
  # media in there then reference as follows:
  tags$img(height = 100, width = 250, src = "shinyzombie.jpg"),
  tags$br(), # Page break
  tags$br(), # Page break

  HTML("<h2>Just for completeness we can write raw HTML if we want to!!!</h2>"),

  actionButton(inputId = "clicks",
               label = "Click me")

)
server <- function(input, output){
  observeEvent(input$clicks, {
    print(as.numeric(input$clicks))
  })
}
shinyApp(ui = ui, server = server)
Messing with the Layout
We can place the UI elements wherever we want to. The main functions that we use to do this are fluidRow() and column which both insert divs. fluidRow() will divide you app into rows creating as many as you want. Next you can create (up to 12) columns within a row specifying both the width and offset of each column like this:
  fluidRow(column(3),  # Takes up 3 units of width
           column(5)), # Takes up 5 units of width
  fluidRow(
           column(4, offset = 8) # Offset the start of the column
           )
Now, if you actually want to see something you pass it to the row or column function like this:
library(shiny)

ui <- fluidPage(

  fluidRow(column(3, tags$p("Hi!!! :)")),  # Takes up 3 units of width
           column(5,
                  sliderInput(inputId = "num",
                              label = "Choose a number please",
                              value = 25, min = 1, max = 100))),
  fluidRow(
    column(6, offset = 1,
           plotOutput("hist"))
  )
)
server <- function(input, output){
  output$hist <- renderPlot({
    n <- input$num
    hist(rnorm(n))
  })
}

shinyApp(ui = ui, server = server)
Stacking Layouts
Panels are the basic UI aggregate element. To place a series of elements together into a panel we wrap them with the wellPanel function. In total there are 12 types of panels supported by shiny:
| Function | Description |
|---|---|
absolutePanel() |
Rigid |
conditionalPanel() |
Determines whether a panel is visible |
fixedPanel() |
Does not scroll |
headerPanel() |
Panel for title - use with pageWithSidebar() |
inputPanel() |
A grouping panel |
mainPanel() |
Displaying output - use with pageWithSidebar() |
navlistPanel() |
Stacking |
sidebarPanel() |
Sidebar of inputs - use with pageWithSidebar() |
tabPanel() |
Stackable |
tabsetPanel() |
Multiple stacked |
titlePanel() |
Apps title |
wellPanel() |
Panel with grey background |
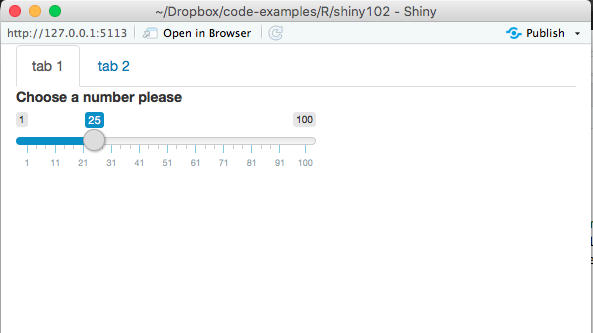
If you want to stack things on top of each other start with tabPanel(). This is a small UI of its own and is a convenient way to break up the various elements of your app. These functions are designed to work in conjunction with tabsetPanel(), navlistPanel and navbarPage(). Here is a quick example.
library(shiny)

ui <- fluidPage(

  tabsetPanel(
    tabPanel("tab 1",
             sliderInput(inputId = "num",
                                  label = "Choose a number please",
                                  value = 25, min = 1, max = 100)
             ),
    tabPanel("tab 1",
             plotOutput("hist")
             )
  )
)
server <- function(input, output){
  output$hist <- renderPlot({
    n <- input$num
    hist(rnorm(n))
  })
}


shinyApp(ui = ui, server = server)
Now navlistPanel() is analogous to the tabsetPanel() except it creates your navigation in a sidebar.
Precanned Layouts
We should have talked about this first… Anyway, nevermind. These are convenience wrappers that let you put together a layout very quickly. The most common is sidebarLayout():
library(shiny)

ui <- fluidPage(

  sidebarLayout(
    sidebarPanel(sliderInput(inputId = "num",
                             label = "Choose a number please",
                             value = 25, min = 1, max = 100)),
    mainPanel(plotOutput("hist"))

  )
)
server <- function(input, output){
  output$hist <- renderPlot({
    n <- input$num
    hist(rnorm(n))
  })
}
shinyApp(ui = ui, server = server)
Other options are fixedPage and navbarPage(). Note when you use navbarPage() you do so by replace the fluidPage() call. You can use the navbarPage() with navbarMenu() to give you drop down lists in the tabs. We can go further, but there is a tutorial on more advanced dashboards here.
CSS
Shiny enables us to stylise our site with our own branding. The way that we do this is to link with a CSS file, writing a global CSS header or write the CSS into a tags style attribute. We can then apply CSS to tags, or classes or ids. This forms a hierarchy that we can use to automatically deal with various aspects of the site overriding the bits that we want to have different.
Shiny makes use of the Bootstrap 3 CSS framework, see https://getbootstrap.com/. To use this we can create a fluidPage() function that contains <div class="container-fluid"></div>. Alternatively we could specify our own CSS file using the following:
ui <- fluidPage(
  tags$head(
    tags$link(
        rel = "stylesheet",
        type = "text/css"
        href = "myfile.css"
      )
    )

)
or you can even just call includeCSS("myfile.css") which will copy a CSS into every page. To learn more about CSS there is a free tutorial at https://www.codecademy.com/tracks/web which covers both HTML and CSS in about 7 hours.
Google Analytics and Things to Come..
A final note, you can incorporate the google analytics into your application pretty easily if you want to have it, see here.
Things in development:
- DT interactive tables that can accept user input.
- leaflet - interaction with maps
- working on interaction with graphics
What Now?
Build an app!