Shiny is a way to deploy your data analyses in an interactive format that is backed by R.
Overview - Think inputs and outputs
Shiny applications comprise a user interface in the form of a web page (generated from R code), a backend server (that can be hosted on your local machine).
Before we begin, your goto page for learning about this stuff is https://shiny.rstudio.com/articles/. Ok, let’s build an app - use this template:
library(shiny)

ui <- fluidPage()
server <- function(input, output){}
shinyApp(ui = ui, server = server)
Add input and output functions into the fluidPage function. We could add any of:
- buttons
- checkboxes (single and grouped)
- date input and range
- file input
- numeric input
- passwords
- radios
- select
- sliders
- text
All these functions take similar parameters, the first being a unique id (inputId) and the second being a label to display to the user. After that there are a bunch of input specific parameters.
Outputs are plots, tables, text, etc that embed various visualisation elements to the user interface. All these outputs contain one required parameter outputId which is a unique id for the object. For example, lets add a slider and a placeholder for a histogram that we are going to produce.
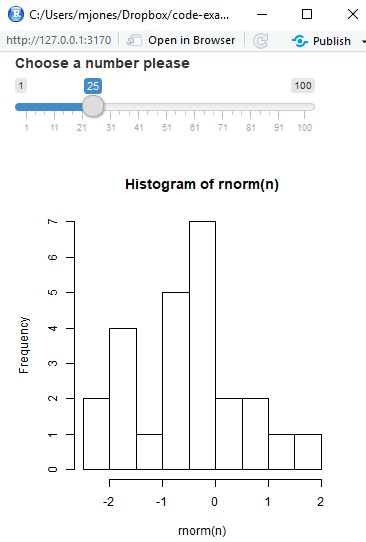
library(shiny)

ui <- fluidPage(

  sliderInput(inputId = "num",
              label = "Choose a number please",
              value = 25, min = 1, max = 100),
  plotOutput("hist")

)
server <- function(input, output){
  output$hist <- renderPlot({
    n <- input$num
    hist(rnorm(n))
    })
}
shinyApp(ui = ui, server = server)
We use the server function to provide the content for the user interface. For each element you need to save the output within the output list object as a named member. The second thing you need to do is to wrap the object that you want to save in a render function. For example we can render:
- static and interactive tables
- images
- plots
- code blocks
- text
- shiny ui elements
In the above example we have rendered a histogram based on some dummy data. We can use as many lines of code as we want between the {} in the render function. Note that you can have multiple reactive variables within a render*() function.
We can access the values that the user selects with the slider in the server function. These are called reactive elements and shiny takes care of the updates. Ok, run the app, you should see something like this:
Final note - to deploy your application you need to save it with the filename app.R. However, if you have massive UI and server elements you can split the application into two files, one called ui.R and the other called server.R. Then, you add all your media content to the folder. After that you can deploy to shinyapps.io but first you need to create an account. After you have created an account, all you need to do is press publish application in the RStudio.