You have just fitted a logistic regression model in R using glm. Your results suggest that treatment group membership (active versus placebo) is strongly associated with the probability of being able to endure open-plan offices, micro-management and your fellow comrades 5 days a week. For the sake of realism, let’s assume the active treatment is a (very) powerful anti-psychotic and that it has been randomised to a simple random sample of employees. We want to know whether this treatment enables people to get through the week without having to book a frontal labotomy for Wednesday. OK, I know what you are asking1 - what, in this dark winter night, is logistic regression and what is an odds ratio?
Logistic regression - all you need to know but forgot to ask
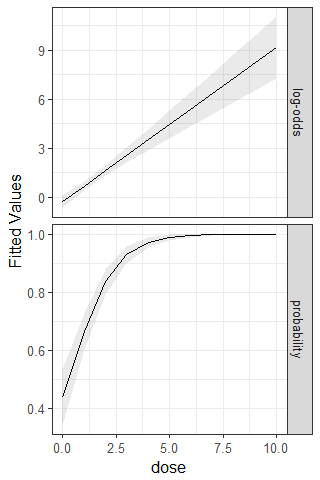
In a very casual (hands in your pockets) sense, logistic regression is just a way to do regression where you are thinking of the response as a probability of some event. You want your results to be bounded between 0 and 1 because it is hard work trying to interpret a probability of -666. Logistic regression achieves this aim2 but normal regression does not. The downside is that we need to introduce the concept of odds. Odds (not odd) are related to probability ($p$) via this equation: $odds = \frac{p}{1-p}$ and in a logistic regression model we relate the logarithm of the odds to a linear combination of covariates. In order to get some intuition via visualisation lets think of how our response might vary based on dosage of the treatment from zero to 10 grams. In this case we have $p = Pr(gets-through-a-week-without-labotomy)$ then for our experiment we have:
$$ logit(p) = log(\frac{p}{1-p}) = \beta_0 + \beta_1 \times dose $$
If we donote the response as $Y$ (we either get through the week or we don’t) and $p = Pr(Y)$ then:
$$ p = Pr(Y) = \frac{1}{1 + e^{-(\beta_0 + \beta_1 \times dose)}} $$
So for the logit we have an unbounded linear function (top figure below) and the probability (lower figure) is non-linear that is bounded by zero and one. Snazzy huh?
Here endith this part.
Odds Ratios sometimes lead us astray…
Going back to the treatment groups scenario (active versus placebo) let’s say our results show the following:
Coefficients:
            Estimate Std. Error z value Pr(>|z|)
(Intercept)  -4.6648     0.3797 -12.284   <2e-16 ***
grp           1.2975     0.4308   3.012   0.0026 **
Exponentiating the parameter estimates gives us the odds ratios. An odds ratio (OR) just tells us how odd things get relative to a reference level. So, say the probability of getting through the week without treatment is about 0.1, i.e. we have about a 10% chance of getting through the week unscathed (literally and financially) by our eager-beaver brain surgeon – let’s call him Zsolt. This corresponds to a baseline odds of $\frac{p}{1-p} = \frac{0.1}{0.9} = 0.111$. If the OR turned out to be 2 then all this means is that the odds of getting through the week if you had the anti-psychotic is 2 times the odds of the other group, i.e. roughly 0.222. In probability terms this equals $\frac{odds}{1 + odds} = \frac{0.22}{1 + 0.22} = 0.18$ i.e. there is a higher proability of getting through the week.
Now, in the model results shown above, the odds ratio for group membership is actually $exp(1.2975) = 3.66$. Following the ideas above, the interpretation is that, on average, the active treatment increases the odds of getting through the week without having to schedule a frontal labotomy by about 3.7 times than the people that get the placebo. The 95% confidence interval for the OR is 1.66 to 9.22. OMG, I LITERALLY CAN’T EVEN!!!!&!!** - let’s go write up our paper and get this genius published!
Hang-on, cool your boots poodle - let’s take a step back and imagine another scenario where we get the following results:
Coefficients:
            Estimate Std. Error z value Pr(>|z|)
(Intercept) -0.35020    0.07415  -4.723 2.33e-06 ***
grp          1.16595    0.10849  10.747  < 2e-16 ***
This time the OR = exp(1.166) = 3.21 and that’s still roughly equal to what we got previously but the intercept term is quite different. What’s going on here?
The turgid spoiler is that your baseline odds are very different. In the first model the baseline odds are 0.01 and in the second model they are 0.7. So, what does this mean in practical terms? Firstly what it means is that you should NEVER take an OR at face value. A useful exercise is to gain more insight is to use the model parameter estimates to predict the probability of getting through the week without a visit to Zsolt using the equation shown earlier. For the first model we have:
$$
Pr(Y|grp = placebo) = \frac{1}{1 + e^{-(-4.6648)}} = 0.009 \\
Pr(Y|grp = active) = \frac{1}{1 + e^{-(-4.6648 + 1.2975)}} = 0.033
$$
and for the second we have:
$$
Pr(Y|grp = placebo) = \frac{1}{1 + e^{-(-0.35020)}} = 0.41 \\
Pr(Y|grp = active) = \frac{1}{1 + e^{-(-0.35020 + 1.16595)}} = 0.69
$$
So under the first set of results there is next to no chance of getting through the week without first having a frontal labotomy regardless of the treatment. In the second case we are a little under the chance of getting heads or tails from a coin flip without the anti-psychotic and have a substantially better chance of getting through the week if we do!!!!
Fin.