The following code simulates events (deaths) from a known model for two groups over three time points. We adopt the view that the effects of time are linear. So, we have deaths acorss two groups (0 = control, 1 = treatment) at three time points (0 = baseline, 1 = 1 year in, 2 = 2 years in). We pre-specify a linear predictor relating group membership and timepoint to the probability of death and then generate bernouli trials based on these probabilities.
The logistic regression model that we consider is:
$$ log Pr(Y = 1) = \beta_0 + \beta_1 grp + \beta_2 time + \beta_3 grp \times time $$
set.seed(250)
# Define the parameters
b0 <- 0.4
b1 <- -0.1
b2 <- 0.2
b3 <- -0.3
n <- 1200
grp <- c(rep(0, n/2), rep(1, n/2))
time <- c(rep(0, n/6), rep(1, n/6), rep(2, n/6), rep(0, n/6), rep(1, n/6), rep(2, n/6))
# Model for the means
p <- b0 + b1 * grp + b2 * time + b3 * grp * time
df.fig <- data.frame(grp = grp, time = time, p = p)
df.fig$y <- rbinom(n, 1, p)
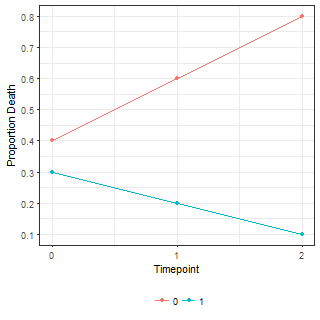
# The probability of death
ggplot(df.fig, aes(x = time, y = p, colour = factor(grp))) +
geom_point()+
geom_line()+
scale_x_continuous("Timepoint", breaks = 0:2)+
scale_y_continuous("Proportion Death", breaks = seq(from = 0, to = 1, length.out = 11))
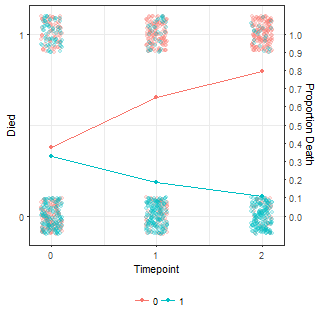
# Proportion of deaths observed in the simulated data
df.tmp <- df.fig %>%
dplyr::group_by(grp, time) %>%
dplyr::summarise(p = sum(y)/n())
# The Simulated data
ggplot(df.fig, aes(x = time, y = y, colour = factor(grp))) +
geom_jitter(height = 0.1, width = 0.1, alpha = 0.2)+
geom_point(data = df.tmp, aes(x = time, y = p, colour = factor(grp)))+
geom_line(data = df.tmp, aes(x = time, y = p, colour = factor(grp)))+
scale_x_continuous("Timepoint", breaks = 0:2)+
scale_y_continuous("Died", breaks = 0:1,
sec.axis = sec_axis(~.,
name = "Proportion Death",
breaks = seq(from = 0, to = 1, length.out = 11)))The probabilities and simulated data are shown below:
| Means (p parameter) | Simulated data |
|---|---|
 |
 |
Now we fit a logistic regression model to the simulated data using the following commands:
summary(lm1 <- glm(y ~ grp * time, data = df.fig, family = binomial()))
exp(coef(lm1))

predict(lm1, type = "response", newdata = data.frame(grp = c(0, 0, 0, 1, 1, 1),
                                                     time = c(0, 1, 2, 0, 1, 2)))
which gives us parameter estimates and predicted values as follows:
Coefficients:
            Estimate Std. Error z value Pr(>|z|)
(Intercept)  -0.4331     0.1333  -3.248  0.00116 **
grp          -0.2935     0.1949  -1.506  0.13210
time          0.9363     0.1144   8.188 2.65e-16 ***
grp:time     -1.6395     0.1757  -9.333  < 2e-16 ***

exp(coef(lm1))
(Intercept)         grp        time    grp:time
  0.6485035   0.7456175   2.5506104   0.1940778

predict(lm1, type = "response", newdata = data.frame(grp = c(0, 0, 0, 1, 1, 1), time = c(0, 1, 2, 0, 1, 2)))
        1         2         3         4         5         6
0.3933892 0.6232216 0.8083892 0.3259346 0.1931308 0.1059346
The exponentiated intercept term represents the baseline odds of death. Similarly, the exponentiated group and time main effects are odds-ratios. However, the exponentiated interaction term is a ratio of odds-ratios, see Table below.
| Term | Exponetiated Coefficient |
|---|---|
| Intercept | Baseline Odds |
| Single coefficient | Odds Ratio |
| Interaction | Ratio of Odds Ratio |
The baseline odds are $exp(-0.4331) = 0.6485$. I have a terrible time thinking in odds (mainly because they are unbounded to the right) so I always convert to probabilities. The baseline odds of death equate to $odds/(1+odds) = 0.393$. This aligns with the b0 parameter in the linear predictor so things look good.
While the main effect for suggests that the treatment group have lower odds of death at baseline, the effect is not significant at the 0.05 level. Nevertheless we know that the probability of death diverges over time and the interaction term is clearly significant so the main effect is usually retained in the model. The result suggests that the odds of death at baseline are a factor of $exp(-0.2935) = 0.746$ lower in the treatment group compared to the control group, i.e. 0.6485 \times 0.746 = 0.484$. In probabilities this implies that the probability of death at baseline in the treatment group is 0.326.
In the control group we expect an increase in the odds of death by a factor of $exp(0.94) = 2.55$ for every unit increase in time. For example, at the first timepoint we expect the odds of death in the control group to be the baseline odds multiplied by 2.55, which is 1.654. This equates to a probability of death equal to 0.62, which aligns approximately with our pre-specified probability of 0.6 (and the predicted values from the code above). Similarly, at the second time point we expect that the odds of death in the control group is a whopping $exp(-0.43 + 2 \times 0.936) = 4.22, again correctly equating to the pre-specified probability of death of 0.808.
The interpretation of the interaction term becomes clear when considering the expected probability of death over time. First we note that in the first timepoint, the odds of death in the treatment group are $exp(-0.43-0.29+0.94-1.64) = 0.24$ equating to a probability of 0.1931. As we saw before, the odds ratio for time in the control group is $exp(0.936) = 2.55$. Similarly the OR for time in the treatment group is $exp(0.9363 + -1.6395) = 0.495$. The ratio of these two values is $0.495 / 2.55 = 0.194$ which equates to the exponentiated interaction term.